
Table Of Contents
- 1Introduction
- 2What Is Data-Driven Decision Making in Higher Education?
- 3Why Is Data-Driven Decision Making Important in Higher Education?
- 4Types of Educational Data for Decision-Making
- 56 Key Strategies for Effective Data-Driven Implementation in Schools
- 610 Effective Ways Colleges Can Use Data to Drive Better Decisions
- 7Conclusion
Introduction
In today’s fast-changing academic world, data-driven decision making in higher education is becoming essential for improving performance and planning smarter strategies. Colleges and universities are increasingly using analytics and AI tools to make informed choices about enrollment, teaching, and student success. In a recent survey of 445 faculty and administrators from over 330 institutions across the U.S. and Canada, 93% said they expect to expand their AI use for work purposes within the next two years. This growing focus on data and technology shows how higher education is shifting toward evidence-based, efficient, and future-ready decision-making.
What Is Data-Driven Decision Making in Higher Education?
Data-driven decision making in higher education refers to the use of accurate, relevant, and timely data to guide institutional strategies, academic planning, and everyday operations. Rather than relying on assumptions, universities and colleges use evidence-based insights to enhance teaching quality, improve student outcomes, and make smarter decisions about resource allocation and long-term growth.
The process typically involves three key stages:
Data Collection
Schools collect various types of data such as attendance records, test scores, behavioral reports, and student feedback through both digital platforms and manual systems. This comprehensive information provides a full picture of student performance and school operations.
Data Analysis and Interpretation
Once collected, the data is analyzed to uncover patterns, trends, and problem areas. Educators use these insights to understand where students excel, where they struggle, and what factors may be influencing outcomes.
Data Application
The final step involves turning insights into action. Data informs decisions at every level from tailoring lesson plans to individual students, to optimizing resource allocation, to designing early intervention programs for those at risk. This evidence-based approach helps schools make smarter, more transparent, and more effective decisions that directly support student success.

Why Is Data-Driven Decision Making Important in Higher Education?
Data-driven decision making in higher education allows institutions to base their strategies on evidence rather than intuition. When schools use data effectively, they can address challenges more strategically and improve outcomes for students, teachers, and the wider community.
Promoting Student Success
Research across both K–12 and higher education shows that data-driven decision making leads to measurable improvements in student performance. By analyzing academic records, assessment results, and engagement data, institutions can identify areas where students need additional support and implement targeted interventions such as tutoring, mentoring, or curriculum changes. In fact, a recent survey found that 90% of higher education leaders believe data-based decision-making is essential to institutional success.
Improving Teaching Effectiveness
Faculty can use real-time data such as quiz results, attendance, or student feedback to refine their teaching methods and adapt lesson plans. This helps instructors focus on areas where students face challenges, making learning more engaging, personalized, and effective.
Optimizing Resources
Data-driven insights enable universities to allocate resources more strategically. By identifying high-need departments or programs, institutions can direct funding, staff, and materials where they create the greatest impact. According to a 2025 study, universities that adopted AI in digital recruitment reported 69% higher workflow efficiency and a 48% positive impact on enrollment outcomes, demonstrating the power of analytics in optimizing institutional operations.
Advancing Equity
Analyzing data helps uncover achievement gaps among different student groups. Schools can then design tailored support programs such as additional assistance for English Language Learners or underrepresented groups to promote equitable learning opportunities.
Enabling Personalized Learning
Adaptive learning technologies utilize performance data to tailor instruction for each student, ensuring they learn at their own pace and receive the right level of challenge and support. Institutions that adopt personalized learning strategies have seen up to 30% higher test scores compared to traditional classroom settings.
Encouraging Proactive Problem-Solving
Tracking attendance, grades, and behavior helps educators spot at-risk students early and offer timely support. The University of Baltimore, for example, uses a data-driven approach to boost student retention. Tools like EDMO Conversation Intelligence make this even easier by analyzing student interactions in real time, helping institutions act quickly to improve success rates.
Strengthening Stakeholder Engagement
Sharing data-based insights with parents and guardians builds transparency and trust. Regular progress updates encourage collaboration between families and schools to support student growth.
Supporting Professional Development
Teacher performance and classroom data such as observation reports and student outcomes can highlight areas for improvement. This ensures professional development programs are targeted and aligned with both educator and student needs.
Types of Educational Data for Decision-Making
To make the most of data analytics, schools and institutions should utilize diverse data sources. These data types provide a well-rounded view of student performance, overall well-being, and institutional efficiency, enabling more informed and impactful decisions.
Academic Performance Data
Academic performance data forms the foundation of data-driven decision making in education. It measures how effectively students are learning across subjects, helping educators refine teaching strategies and improve curriculum design. According to the U.S. Department of Education, 48% of teachers have access to electronic student-data systems that support instruction and planning.
- Assessment Scores: Standardized and formative assessments reveal learning gaps and highlight areas of strength. Tracking assessment trends over time helps evaluate progress and guide curriculum improvements.
- Graduation Rates: Changes in graduation rates over multiple years provide insights into how effectively a school is preparing students for higher education and future careers.
- Course Completion: High dropout or failure rates in specific subjects can signal the need for interventions such as tutoring or differentiated instruction.
- Growth Measures: Metrics like year-over-year improvement and value-added scores provide a deeper understanding of student development beyond static test results.
Data Behavior Data
Behavioral data provides insights into students’ engagement, motivation, and overall school climate. It helps educators identify and address issues that go beyond academics. According to a report, about 25% of U.S. high schools face severe absenteeism, with over 30% of students being chronically absent.
- Attendance Patterns: Chronic absenteeism often correlates with poor academic performance. Tracking attendance trends helps schools intervene early through mentoring or family outreach.
- Disciplinary Incidents: Monitoring disciplinary data allows schools to evaluate the impact of behavioral policies and develop more equitable support systems.
- Engagement Metrics: Participation in extracurricular activities, classroom discussions, or digital learning platforms can reflect students’ enthusiasm and connection to school life.
- Participation Rates: Examining who takes part in clubs, sports, or enrichment programs helps identify inclusion gaps and opportunities to boost engagement.
Life Skills and Well-Being Data
Academic success is closely tied to students’ emotional, social, and personal development. Collecting life skills data supports a holistic approach to education.
- Student Surveys: Feedback from students about their learning experiences and school environment provides valuable insights often missed by academic metrics.
- Well-Being Indicators: Data related to emotional and mental health helps identify where students may need counselling or wellness support. In fact, 70% of college students said they’ve struggled with mental health since starting college, according to a U.S. News/Generation Lab survey of 3,649 students.
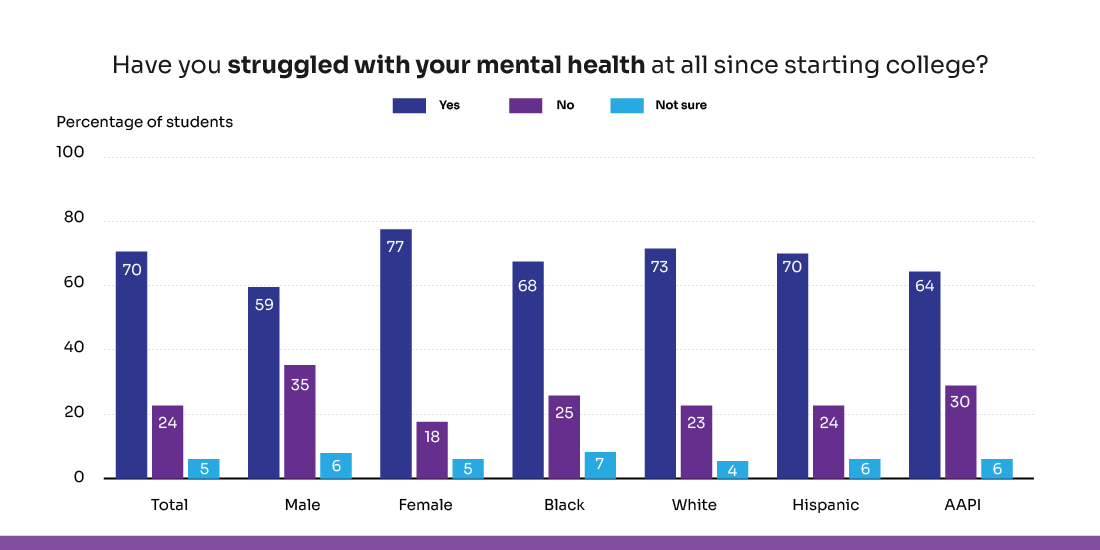
Source: U.S.news
- Environmental Factors: Understanding community-based challenges such as food insecurity, housing instability, or limited internet access helps schools provide targeted support and equitable learning opportunities.
Operational Data
Operational data ensures that a school’s internal systems and resources function efficiently and align with educational priorities.
- Resource Allocation: Reviewing how funding, materials, and staff are distributed across departments helps identify inefficiencies or underserved areas.
- Staff Performance: Evaluating teacher and staff performance data supports professional development and enhances instructional quality.
- Program Effectiveness: Measuring program outcomes instead of intentions allows schools to focus resources on initiatives that demonstrate real impact.
- Budget Utilization: Analyzing financial data ensures that expenditures align with school goals from classroom supplies to infrastructure and technology investments.
A strong culture of data-driven decision making in higher education involves combining different types of data academic, behavioral, social, and operational. When analyzed together, these insights help educators and leaders make informed, fair, and future-focused decisions that support continuous improvement across the institution.
Read more: Best solutions for managing educational data effectively
6 Key Strategies for Effective Data-Driven Implementation in Schools
Successful decision-making in higher education requires a clear plan, a strong framework, and alignment with institutional goals. The following best practices can help colleges and universities use data effectively to drive meaningful actions and long-term results.
Identify and Remove Bias
Ensure that data collection and interpretation are fair and inclusive. Biased data—such as disciplinary reports that disproportionately affect certain student groups can reinforce inequities instead of solving them. Schools should regularly review datasets, include diverse perspectives in decision-making, and build systems that minimize subjective influence.
Define Clear, Measurable Goals
Set specific and trackable objectives for every data-driven initiative. Instead of broad goals like “improve student engagement,” use measurable targets such as “increase extracurricular participation by 15% within one year.” This clarity creates accountability and makes it easier to track success and make informed adjustments.
Focus on Data Accuracy and Quality
The value of data depends on its accuracy. Collect relevant and up-to-date information to ensure the insights you derive are reliable. Conduct regular data audits to identify errors, standardize entry procedures, and train staff in best practices for data handling. High-quality data leads to stronger decisions and better educational outcomes.
Track and Evaluate Progress Regularly
Regular monitoring helps schools assess the effectiveness of their data-driven strategies. Setting monthly or quarterly reviews allows educators to analyze key metrics like attendance, test scores, and student engagement. Sharing progress with teachers, parents, and administrators fosters collaboration and ongoing improvement. For instance, at Florida International University, using data analytics contributed to a 10% rise in four-year graduation rates.
Make Data Easy to Access and Understand
Design dashboards and reports that are simple to navigate and tailored to each audience. Teachers should easily view classroom-specific insights like student growth or participation trends, while administrators should access broader analytics, such as overall program impact or district-wide outcomes. Clear visualization helps everyone make informed decisions quickly.
Invest in Scalable and Integrated Tools
Choose technology platforms that integrate with existing systems, provide strong analytics capabilities, and grow with your organization’s needs. Look for tools that support customization, easy data visualization, and secure access. The right technology makes it easier to turn raw data into actionable insights that drive long-term improvement.
10 Effective Ways Colleges Can Use Data to Drive Better Decisions
Colleges and universities today have access to more data than ever before from admissions and academics to digital engagement and alumni success. When used strategically, this data can help institutions make informed decisions, improve student experiences, and optimize operations. Here are ten practical ways higher education institutions can leverage data effectively:
Strengthen Decisions with Historical Trends and Forecasts
Data helps colleges make smarter choices by revealing past patterns and predicting future outcomes. Leaders can analyze enrollment, graduation, and program trends to plan effectively. Instead of relying on intuition, they use evidence for better results. For example, Western Kentucky University increased tuition revenue by about US$2.4 million through data-driven enrollment strategies.
Measure the Success of Initiatives
Tracking data helps colleges evaluate the impact of their strategies and programs. By comparing expected results with actual outcomes, institutions can identify what works and where to improve. Continuous evaluation also promotes accountability and growth. For example, in Texas, applications from first-generation college students increased by 72% year-over-year through data-driven outreach efforts.
Improve Student Outcomes with Actionable Insights
Using student performance data enables colleges to identify gaps in learning and implement strategies that enhance outcomes. As institutions move toward data-informed teaching, analytics tools can highlight which programs or support services most effectively boost student achievement, helping educators tailor instruction to meet student needs.
Support At-Risk Students Through Early Intervention
Data analytics helps identify students who may need extra support, such as first-generation learners or those with low GPAs. By spotting early warning signs, faculty can offer timely help through tutoring, mentoring, or academic workshops. At Oklahoma State University, using academic-alert notifications reduced course withdrawals by 30% and increased the number of students earning grades above a C by 4%, showing how early intervention can boost student success.
Analyze Retention and Completion Trends
Retaining existing students is more cost-effective than recruiting new ones. Using data, colleges can identify where retention issues occur by program, student group, or course level and develop targeted solutions to improve completion rates. Recent data from the National Student Clearinghouse Research Center shows a 5% decline in enrollment among 18-year-old U.S. freshmen, highlighting the growing need for proactive retention strategies in higher education.
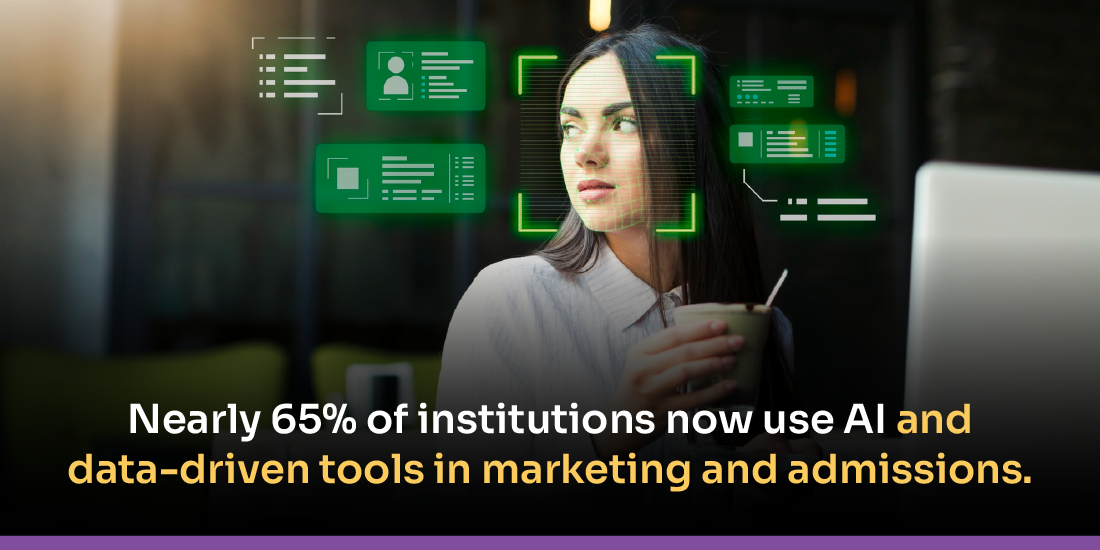
Optimize Marketing and Recruitment Efforts
Enrollment data helps colleges understand where students come from, which campaigns work best, and which channels generate the most applications. This insight allows marketing teams to focus on high-performing regions and platforms for better results. Nearly 65% of institutions now use AI and data-driven tools in marketing and enrollment, with 48% reporting a positive impact on their enrollment funnels.
Enhance Curriculum Design and Delivery
Course-level data, such as dropout rates or student feedback, can uncover areas where academic programs need improvement. For example, courses with high failure rates may need redesigned assessments, different scheduling, or additional instructional support. Data empowers curriculum committees to make evidence-based improvements that boost learning outcomes.
Evaluate Faculty Performance and Productivity
Faculty data such as teaching loads, course evaluations, and enrollment trends can help administrators assess productivity and resource use. For instance, if part-time faculty courses have consistently lower completion rates, institutions can consider offering more support or adjusting teaching assignments to improve student outcomes and cost efficiency.
Manage and Optimize Resource Allocation
Each class or program involves resources classrooms, equipment, staff, and utilities. Data-driven insights help colleges identify where resources are underused or stretched too thin. This information allows for more efficient scheduling, budgeting, and facility management, ensuring that funds are directed toward the areas with the greatest impact.
Integrate Data Across Digital Platforms
Colleges collect valuable data across various digital touchpoints websites, social media, email campaigns, and mobile apps. By connecting these systems, institutions can gain a holistic view of engagement trends, understand how prospective students interact with their brand online, and use these insights to strengthen communication and recruitment strategies.
Conclusion
Data-driven decision making in higher education is no longer just an innovation it’s a necessity. As institutions face increasing pressure to improve student outcomes, optimize resources, and plan strategically, relying on data and analytics provides a clear competitive advantage. By using the right key metrics, universities can track progress, identify challenges early, and make informed choices that enhance both academic quality and operational efficiency.
Frequently Asked Questions
Question 1. What resources are necessary for a data-driven culture in higher education?
Question 2. How long does it take to create a data-driven culture?
Question 3. What are the key metrics for data-driven decision-making in higher education?
Question 4. How does the decision-making process in higher education benefit from data analytics?
Question 5. How do AI and data tools enhance decision-making in higher education settings?
Question 6. What challenges do institutions face when adopting data-driven practices?
Question 7. How can institutions encourage staff and faculty to use data more effectively?
Written By


You May Also Like
 AI in Education
 AI in Education
 AI in Education
No comments yet. Be the first to comment!
Leave a Comment